NinjaTrader Automated Trading by Algo Futures Trader

hybrid algorithmic automated futures trading for prop firm traders, day & swing traders

🚀 Get Started FREE!
  • 🚀Get Started
  • NinjaTrader
  • Get Funded
  • Trading Servers
  • Trading Group
  • Pricing
  • Videos
  • Blog
  • Help

Archives for October 2022

Session Fib Grid Trend Power bias and Signal Age explained

October 21, 2022 by AFT

USAR Trend Bias and Signal Age

So, what are these numbers and where do they come from?

AFT8 TrendOmeter Grid
AFT8 TrendOmeter Grid for the NinjaTrader desktop trading platform – multi-session, multi-timeframe technicals, and trend correlations.
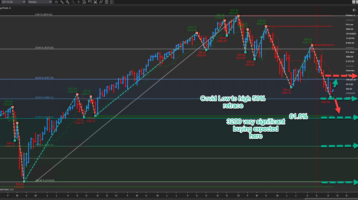
  • Fib Grid is a map/contextual view of the market, with price normalized as a percentage. This is an adaptive formula computed at the session start. Price moves within the grid, which is static all session. 0% is the open, F100% is the projected high, and -F100% is the projected low.
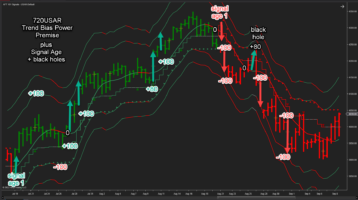
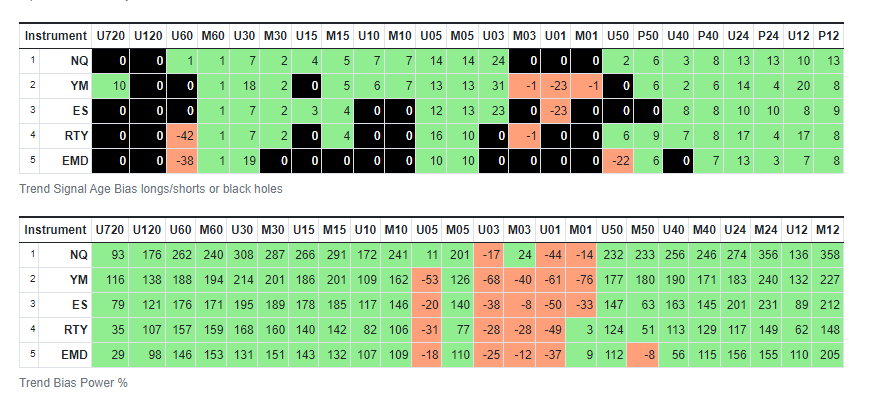
  • Trend Bias Power is a non-lagging real-time expression of the current trend/force. It is a volatility dynamic calculation on each market data change. Price moves within the grid of bands during the bar – 0% is the band, 100% is the outer volatility bands.
  • Signal Age marks when the trend began and if it’s valid or invalid, also known as a “black hole.”

TrendOmeter runs in the NT8 market analyzer and is aimed at high-spec, low-latency gaming desktop PCs and laptops, as it will lag up NinjaTrader 8 and slow down data processing on the system. AFT comes with lite workspaces to avoid this issue, and users can also use the AWT TrendOmeter system, which is lag-free and is a far more sophisticated system for web, desktop, and mobile. AFT8 will link via an API to AWT to allow filtering and signals off AWT.

Alpha Web Trader - TrendOmeter
Alpha Web Trader – TrendOmeter provides a lag-free aggregated instrument and multi-timeframe vertical and horizontal view of the market.
AlphaBias
https://alphawebtrader.com/alphabias shows the trend bias power and the Signal Age view in one screen.

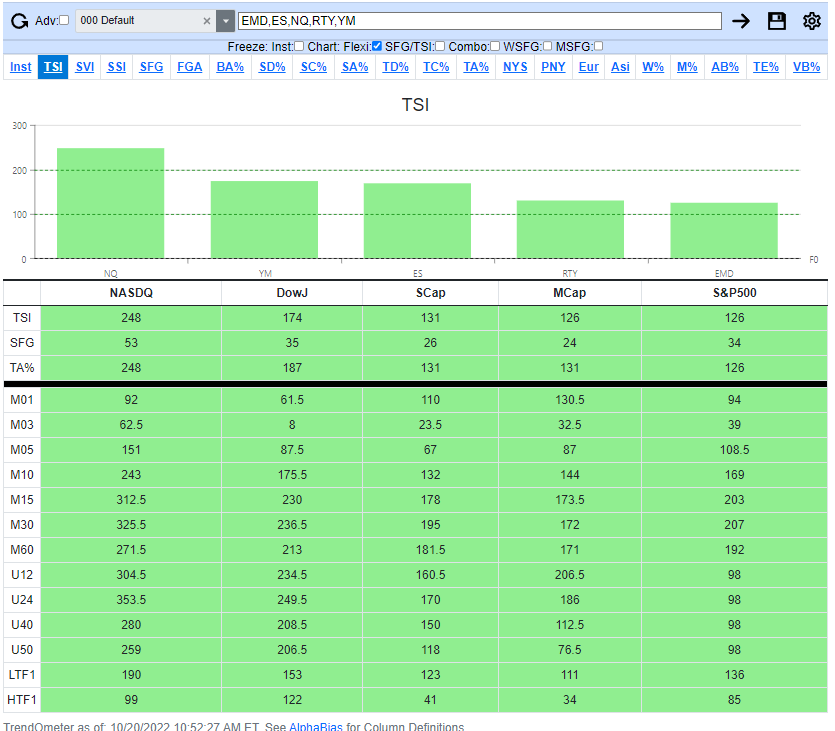
AWT Advanced TrendOmeter is lag-free and will not slow down the PC or NinjaTrader. https://alphawebtrader.com/trendometer TrendOmeter here is showing 13 timeframes using Trend Bias Power. These timeframes are actually aggregations of related instruments and other timeframes combined from around 25 time series and different measurement studies. It is a pivot of the AlphaBias view: https://alphawebtrader.com/alphabias. AWT aggregates instruments such as SPY, VOO, IVV into one stream and aggregates the technicals for TrendOmeter and AlphaBias, so it would use the parent instrument, e.g., SPY, as the display. ES, SP, MES, for example. AWT also uses its own data stream and analytics engine, so it’s roughly equivalent to what you can see in AFT but never exact. AWT shows us breadth and depth based on correlations.

Trend Bias Power and Signal Age
Trend Bias Power and Signal Age provide a 2D view of the trend. The signal age shows trend start and when the trend is invalid as a black hole.

Trend Bias Power % In the chart of the 720min with the USAR indicator, we can see the mid-band is 0%, the upper band 1 is +100%, and the lower band 1 is -100%. Price moves from the mid-band out, so we can normalize price as a percentage. The bands are volatility intervals from the band, so it moves and adapts with the market price cycles of range. TSI/TA comes from this. Trend Bias Power is similar to the Fib Grid in some parts based on volatility and the relation of price within, but it is calculated and moves with the market on each bar. The Trend Bias Power % band could be any number of technical studies. Some examples typically for Moving Averages we use 20, 21, 34, 55 SMA, EMA, WMA with a 1 ATR band to define the 100% above and below -100%. For USAR, we use 1ATR, 1.25, 1.5, and 2.0 with a 1ATR volatility band to define the 100% zone. AFT8 focuses on USAR, Keltner wave, and MA Bands in the AFT8 indicators. Our measurements TA% and TSI come from Trend Bias Power.
Signal Age measures when the trend started and how old it is. SA% comes from this, etc. A black hole is where the signal, for example, is short when the trend first began, but if the trend is contra trend signal direction and it is losing, then it is an invalid trend and marked as a black hole. It could mean the system is transitioning and reversing or in a pullback. So we can focus on the confluence of winning valid trends and ignore or wait for the black holes to go green or red. A mixed view would be green, black, and red. A significant trend direction would be all one color.

Session Fib Grid
Session Fib Grid is a map of the monthly, weekly, or daily sessions with price normalized as a percentage, calculated at the start of each session and fixed.

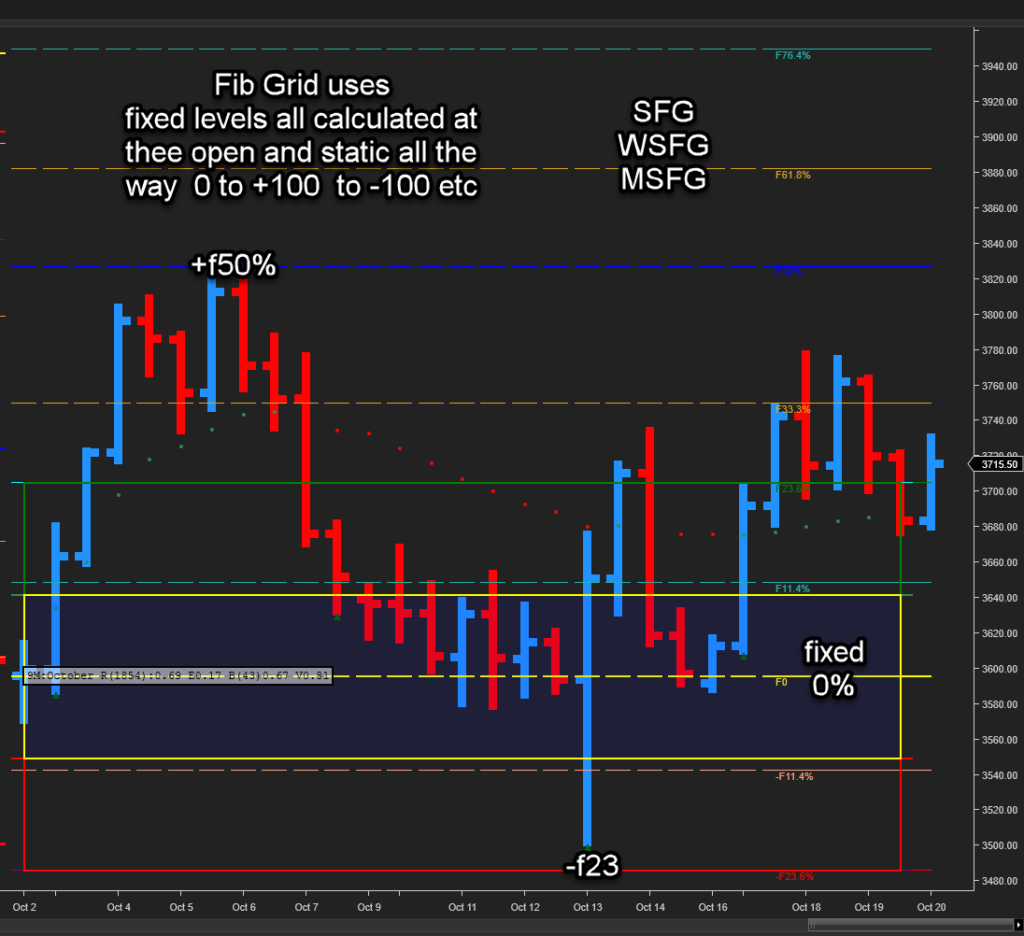
Fib Grid is a map of the market with price normalized as a percentage, computed at the session start. Price moves within the grid. Fib Grid’s 0% stays static, whereas the Trend Bias’s 0% moves as the anchor point, typically some kind of band average moves with price. SFG uses the daily, weekly, monthly typical ranges usually above and below, but it can use different. So 0 is the open, +100 is the projected high, and -100 is the projected low. Other fib numbers are put in as intervals and no trade zone, and the rest is just statistical.

Trend Bias Power, Signal Age, and Session Fib Grid combined give a good view of the session price position and the trend flow, etc. So now we can move away from the old, stuck-in-the-mud classical lagging systems and start to build a 3D view, especially with other related instruments and order/speed, and so on. Get started 100% free until you decide with AFT Trading System.

Filed Under: AFT8, Algo Futures Trader, NinjaTrader 8 Tagged With: Session Fib Grid, Signal Age, Trend Bias Power


🚀 Get Started 100% FREE!

Fed 2022 and the bear market

October 17, 2022 by AFT

S&p500 above support of the 50% retrace
S&P500 Chart
S&P500 just tested above the 50% retrace from the COVID low to high – next stop 3450 zone and 3200 below.

The central point of both the US system and the equity market is the CPI. The three elements that interest the Fed to intervene are (according to Bernanke’s teachings at Princeton) currently managed by outdated “80s methods:

  1. The short-term money supply:
    • M3, but it refers to Q2 and therefore is old data.
    • The total average weekly earnings – BLS Employment Report. This data shows that as of September 2022, on an overall level, total weekly earnings are year-over-year slightly negative in real terms, but at the individual level, the loss of purchasing power is 3.4%.
  2. Consumption – BEA Personal Income. See the attached tables, which reveal that consumption in real terms as of August 2022 is negative year-over-year and year-to-date, both using the PCE and the CPI as deflators.
  3. The CPI, which is our focus today.

View the Economic Analysis: https://algotradingsystems.s3.amazonaws.com/docs/V+studies.xls

One of the elements alerting us to new pushes or brakes on the CPI is the analysis of the CPI 3 months annualized – elaboration of the BLS CPI report Tab 3 – sheet 3. It is evident that it is a much faster sensor than the year-over-year measure. Demonstration:

  • 3 months indicated strong and increasing pressures on the CPI in February 2021, while year-over-year detected it in May – sheet 3 line 72 and line 123.
  • Let’s see the situation in 2022 to date – 3 months – line 123 and following:
  • The maximum inflationary push 2021-2022 occurs in June 2022 at +12.26 annualized and then collapses at the end of Q3 September 2022 to 0.67.
  • This indicates that at the US system level, the price system, TODAY, has been frozen, with sectors still showing strong increases and others strong contractions.

September 2022 – Q3 2022 – column E shows the weight on the CPI of the various sectors:

  • Overall situation of frozen prices:
  • Sectors that create a strong boost to CPI growth:
    • Food – weight 13.635% – +10.92 annualized. All sectors of food at home and away from home.
    • Energy services – Electricity – due to the high prices of inventories of production fuel.
  • All items less food & energy – weight 78.12% – still high at 5.11 annualized but trending down from June 7.43. This figure is strongly conditioned by the shelter – line 152 – weight 32.47% on the CPI – which remains high and growing. Rent and Equivalent Rent (Mortgages) due to the increase in Fed rates.
  • Sectors that offset the increases – Energy weight 8.24% – the decline in the CL of the “bad” Saudi.

FOOD:

  • The strong push is due to two factors:
  • Domestic and international agricultural production below demand. It is bad economic planning that cannot be resolved in the short term and cannot be resolved with interest rates.
  • A high-cost US production that has significant consequences on manufacturers’ inventories.
  • The fortune of Import prices – BLS Release – Food Feeds and Beverage – 3 months prices annualized September 2022 -9.14, June 2022 -1.90, March 2022 +21.16 – year-over-year September 2022 +3.43%, June 2022 +8.70%, March 2022 +13.62%. It is evident that at the import level there is a strong slowdown in prices. The boost in food is created in particular by Vegetables +20% 3 months annualized +15.50% year-over-year – lack of production. Prices are expected to drop with Southern Hemisphere harvests – December 2022 to April 2023.

SHELTER:

  • It is the Fed’s own policy that creates the inflationary push.

Conclusion:

  • The three elements that should guide the Fed’s monetary policy suggest CAUTION:
  • A consumer with a loss of real purchasing power.
  • Negative consumption in real terms, either using the PCE or the CPI as a deflator.
  • Inflationary pressure created by food due to a lack of domestic production. The increase in production in the agricultural sector is possible but it takes time and investments. The prices of the sector do not respond to interest rates. The growing inflationary pressure created by the shelter – 34% of the CPI – the same Fed policy creates it.

The Fed has already decided on a rate hike of 0.50 / 0.75 in November 2022. The risk is that they will make the same mistakes as Volcker in the 80s that brought the country and the market into recession.

Due to the forecast for November and the Christmas period, it is very likely the bottom will be set before March 2023, and we can expect some type of V bounce or large volatile frothy rallies to continue.

For more EcoNews, technicals, and fundamental analysis, join us for free in the trading group.

Filed Under: Algo Futures Trader Tagged With: fundamentals


🚀 Get Started 100% FREE!

Help & Information

  • ninjatrader automated trading
  • Automated Trading Systems
  • Support Center
  • Help Desk Articles
  • Trading Group & Forum
  • Videos

Recent Posts

  • Prop Firm Trading Futures Accounts Mastering the Live Trailing Threshold
  • Low-Volume, Low-Volatility Sessions: What the Macro Backdrop Is Really Telling Us
  • GDP negative print is about global weakness and measurement quirks, not an outright U.S. recession
  • US Economics the failure of reciprocal tariffs and tax policy on the US system is not the end of the road alternatives do exist
  • AFT8 AWT Signals Indicator datafeed via AWT Desktop fixes
  • Facebook
  • RSS
  • Twitter
  • YouTube


  • NinjaTrader Automated Trading
  • automated futures trading
  • automated trading systems
  • Day Trading Futures
  • Get Started Day Trading Futures
  • VIP Trading Group Live Market Trade Along
  • Secret to Day trading futures success
  • AFT8 for NinjaTrader 8
  • Futures Algo Trading Systems
  • Market News
  • NinjaTrader Free Trading Platform
  • Legal Notices
  • AFT Legal Info
  • Terms
  • FULL RISK DISCLOSURE
  • Privacy Policy
  • Cookie Usage
  • About AlgoFuturesTrader
  • Connect to AFT
  • Blog
  • Videos
  • Support
  • Contact
  • My account
  • Sitemap
  • Affiliates

Algo Futures Trader Copyright Algo Trading Systems© 2025 ·
AlgoFuturesTrader.com is owned & operated by Algo Trading Systems LLC. By using this website or products & services, you are bound by our Terms & subject to US legal jurisdiction only. Errors & omissions excluded.
AFT made in England, powered by MicroTrends NinjaTrader development

Disclaimer: Trading & investment carry a high level of risk. AlgoFuturesTrader does not make recommendations for buying or selling any financial instruments, nor do we offer trading or investment advice. We are a software company, and we only provide educational information on ways to use our sophisticated Algo Futures trading tools. It is up to our customers & readers to make their own trading & investment decisions, or consult with a registered investment advisor.

Risk Disclosure: Futures, CFDs, & forex trading carry substantial risk and are not suitable for every investor. An investor could potentially lose all or more than the initial investment. Risk capital is money that can be lost without jeopardizing one's financial security or lifestyle. Only risk capital should be used for trading, and only those with sufficient risk capital should consider trading. Past performance is not necessarily indicative of future results. Please read the full risk disclosure here.

Hypothetical performance results have many inherent limitations, some of which are described below. No representation is made that any account will or is likely to achieve profits or losses similar to those shown. In fact, there are frequently sharp differences between hypothetical performance results and the actual results subsequently achieved by any particular trading program. One of the limitations of hypothetical performance results is that they are generally prepared with the benefit of hindsight. In addition, hypothetical trading does not involve financial risk, and no hypothetical trading record can completely account for the impact of financial risk in actual trading. For example, the ability to withstand losses or adhere to a particular trading program despite trading losses are material points that can adversely affect actual trading results. Numerous other factors related to the markets or the implementation of any specific trading program cannot be fully accounted for in the preparation of hypothetical performance results and can adversely affect trading results.

Testimonials appearing on this website may not be representative of other clients or customers and are not a guarantee of future performance or success.

NinjaTrader® is a registered trademark of NinjaTrader Group, LLC. No NinjaTrader company has any affiliation with the owner, developer, or provider of the products or services described herein, nor do they endorse, recommend, or approve any such product or service.

We use cookies on our website to give you the most relevant experience by remembering your preferences and repeat visits. By clicking “Accept All”, you consent to the use of ALL the cookies. However, you may visit "Cookie Settings" to provide a controlled consent.
Cookie SettingsAccept All
Manage consent

Privacy Overview

This website uses cookies to improve your experience while you navigate through the website. Out of these, the cookies that are categorized as necessary are stored on your browser as they are essential for the working of basic functionalities of the website. We also use third-party cookies that help us analyze and understand how you use this website. These cookies will be stored in your browser only with your consent. You also have the option to opt-out of these cookies. But opting out of some of these cookies may affect your browsing experience.
Necessary
Always Enabled
Necessary cookies are absolutely essential for the website to function properly. These cookies ensure basic functionalities and security features of the website, anonymously.
CookieDurationDescription
cookielawinfo-checkbox-analytics11 monthsThis cookie is set by GDPR Cookie Consent plugin. The cookie is used to store the user consent for the cookies in the category "Analytics".
cookielawinfo-checkbox-functional11 monthsThe cookie is set by GDPR cookie consent to record the user consent for the cookies in the category "Functional".
cookielawinfo-checkbox-necessary11 monthsThis cookie is set by GDPR Cookie Consent plugin. The cookies is used to store the user consent for the cookies in the category "Necessary".
cookielawinfo-checkbox-others11 monthsThis cookie is set by GDPR Cookie Consent plugin. The cookie is used to store the user consent for the cookies in the category "Other.
cookielawinfo-checkbox-performance11 monthsThis cookie is set by GDPR Cookie Consent plugin. The cookie is used to store the user consent for the cookies in the category "Performance".
viewed_cookie_policy11 monthsThe cookie is set by the GDPR Cookie Consent plugin and is used to store whether or not user has consented to the use of cookies. It does not store any personal data.
Functional
Functional cookies help to perform certain functionalities like sharing the content of the website on social media platforms, collect feedbacks, and other third-party features.
Performance
Performance cookies are used to understand and analyze the key performance indexes of the website which helps in delivering a better user experience for the visitors.
Analytics
Analytical cookies are used to understand how visitors interact with the website. These cookies help provide information on metrics the number of visitors, bounce rate, traffic source, etc.
Advertisement
Advertisement cookies are used to provide visitors with relevant ads and marketing campaigns. These cookies track visitors across websites and collect information to provide customized ads.
Others
Other uncategorized cookies are those that are being analyzed and have not been classified into a category as yet.
SAVE & ACCEPT