So what are these numbers and where do they come from?

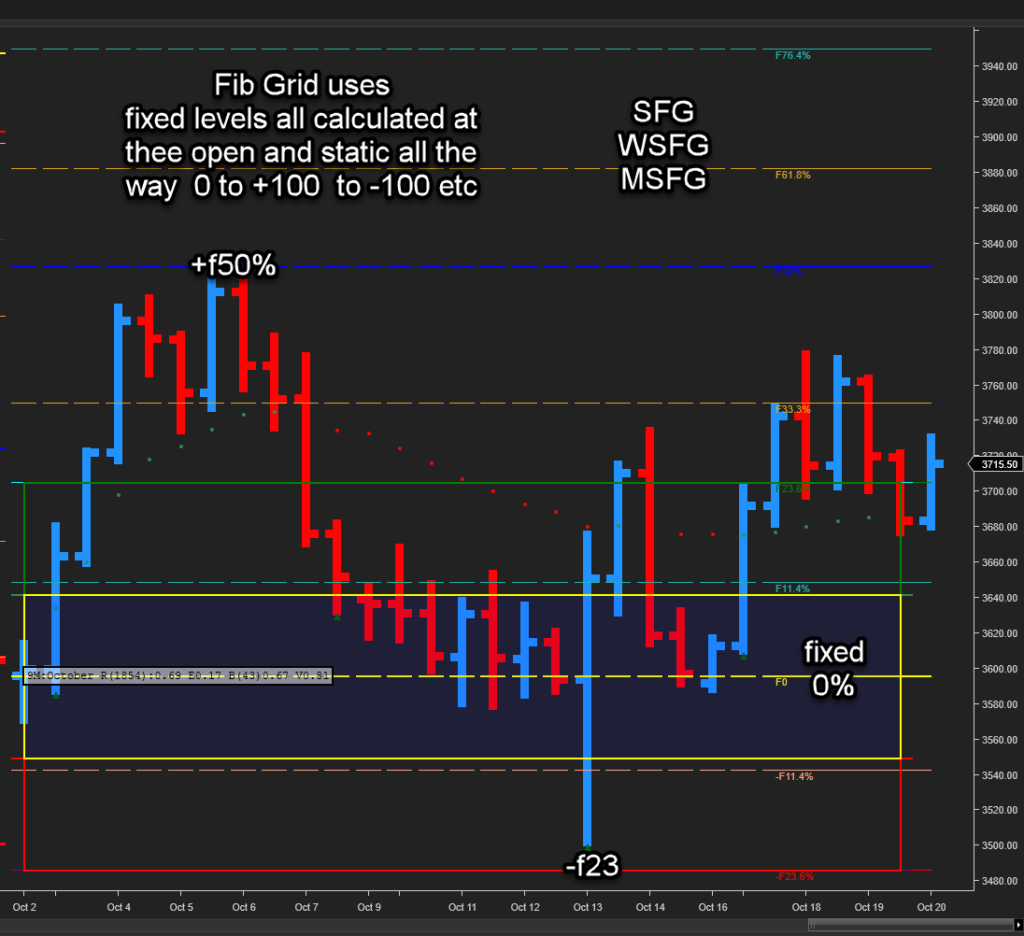
- Fib Grid is a map/contextual view of the market, price normalized as %. This is an adaptive formula computed at the session start – price moves within the grid, which is static all session 0% the open, F100% is projected high and -f100% low.
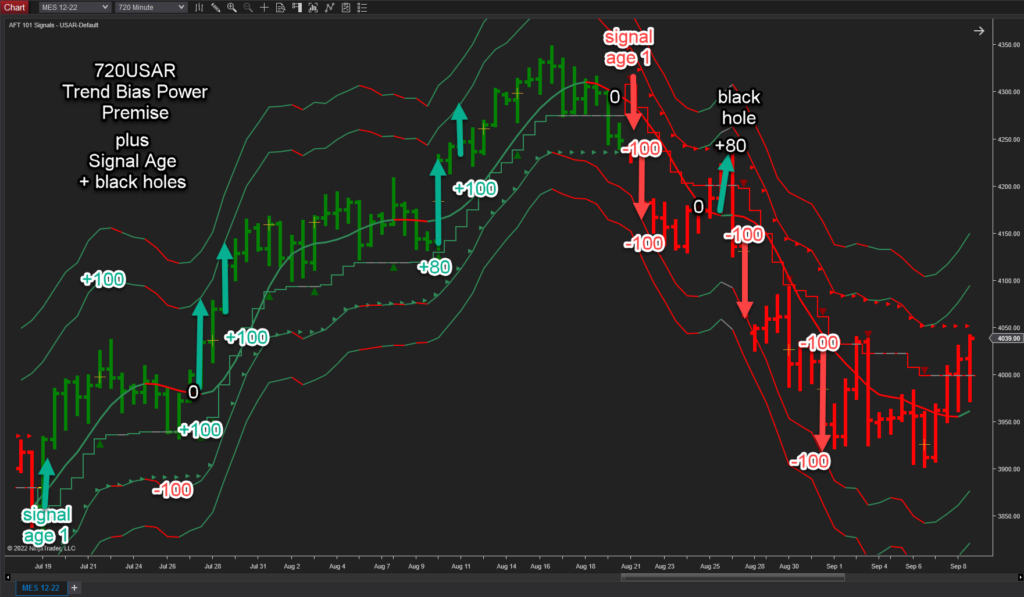
- Trend Bias Power is an non lagging realtime expression of current trend/force, is a volatility dynamic calculation on each market data change, price moves within the grid of bands during the bar – 0% the band 100% outer volatility bands
- Signal Age – marks when the trend begun and if its valid or invalid aka a “black hole”
Trendometer runs in the NT8 market analyzer and is aimed for high spec low latency gaming desktop PCs and laptops as it will lag up NinjaTrader 8 and slow down data processing on the system – so AFT comes with lite workspaces to avoid this issue and users can also use the AWT trendOmter system which is lag free and is a far more sophisticated system for web, dekstop and mobile – AFT8 will link via an API to AWT to allow filtering and signals off AWT.


AWT Advanced Trendometer lagging free – will not slow down the PC or NinjaTrader. https://alphawebtrader.com/trendometer Trendo here is showing 13 time frames using Trend Bias Power – these timeframes are actually aggregations of related instruments and other timeframes combined from around 25 time series and different measurement studies. – it is a pivot of the Alphabias view : https://alphawebtrader.com/alphabias
AWT aggregates instruments such as SPY,VOO, IVV into 1 stream and aggregates the technicals for Trendo and AB so it would use the parent instrument eg SPY as the display. ES, SP, MES for example AWT also uses its own data stream and analytics engine so its roughly equivalent to what you can see in AFT but never exact. AWT is showing us breadth… and depth. based on correlations

Trend bias Power % In the chart of the 720min with USAR indicator – we can see the mid band is 0% the upper band 1 is +100% the lower band 1 is -100% price moves from the mid band out – so we can normalize price as a % The bands are volatility intervals from the band- so it moves and adapts with the market price cycles of range. TSI / TA comes from this. Trend bias Power is similar to the Fib Grid in some parts based on volatility and the relation of price within – but it is calculated and moves with the market on each bar – the Trend Bias Power % – band could be any number of technical studies – some examples typically for Moving Averages we use 20, 21, 34, 55 SMA, EMA, WMA with a 1 ATR band to define the 100% above and below -100%- USAR we use 1ATR. 1.25, 1.5 and 2.0 with a 1ATR volatility band to define the 100% zone. AFT8 focus is USAR, Keltner wave and MA Bands in the AFT8 indicators. Our measurements TA% and TSI comes from Trend Bias Power.
Signal Age measures when the trend started and how old it is. SA% comes from this etc.
A black hole is where the signal for example is short when the trend first begun – but if the trend is contra trend signal direction and it is losing – then it is an invalid trend and marked as a black hole. It could mean the system is transitioning and reversing or in a pullback. So we can focus on the confluence of winning valid trends and ignore or wait for the black holes to go green or red – a mixed view would be green black and red – a significant trend direction would be all one color.

Fib Grid is a map of the market price normalizes as % computed at the session start – price moves within the grid.. Fib Grid the 0% stays static where as the Trend Bias the 0% moves as the anchor point typically some kind of band average moves with price. SFG uses the daily, weekly, monthly typical ranges usually above and below but it can use different. So 0 is the open +100 is the projected high and -100 is the projected low… other fib numbers are put in as intervals and no trade zone and the rest is just statistical.
Trend Bias power/ Signal Age and Session Fib Grid combined they give a good view of the session price position and the trend flow etc. so now we can move away from the old stuck in the mud classical lagging systems… and start to build have a 3d view + especially with other related instruments and order/speed and so on. Get started 100% free until you decide with AFT Trading System
